Monthly Index Tracks Robust Rebound in Sales at Hawai‘i Restaurants
Food Gurus Hawaii Restaurant Index is based on over 125,000 daily transactions at more than 130 restaurant units statewide.

Welcome to the first edition of the Food Gurus Hawaii Restaurant Index, which tracks the vigorous rebound in local restaurant revenue and customers.
Sales in April increased a robust 9% over March, which itself had been stronger than previous months. Every category and measure in the index were up and driven both by local customers and tourists.
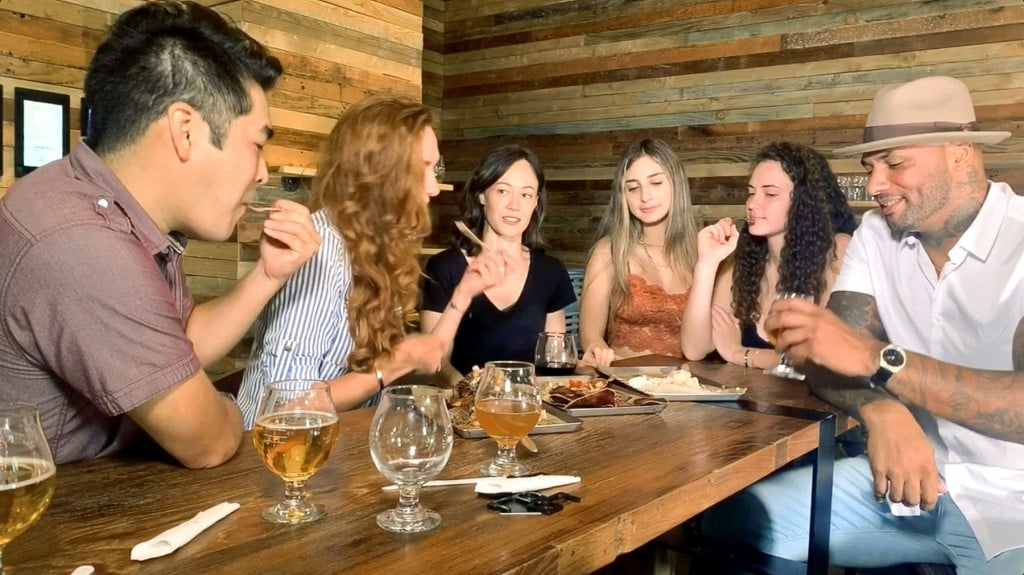
Key elements are more guests dining at restaurants, especially on weekends, plus more dining with alcoholic beverages and larger check averages. However, limits on seating and sanitation protocols “are still choking table turns and causing lines during peak times,” according to the Harris Agency, a marketing and communications company that supplies details of the Food Gurus Index to Hawaii Business Magazine.
The index tracks more than 4.2 million restaurant transactions each month from more than 130 restaurants and hot food outlets across the Hawaiian Islands. The index includes a spectrum of local restaurants, including casual and fine dining; Waikīkī and Neighbor Island resort areas; and quick-service restaurants and hot-food sales from selected stores.
The strongest categories were resort/Waikīkī, with average daily sales up 10% in April over March, and O‘ahu restaurants, up 9%.
Pick-up and take-out sales were up 8% at quick service restaurants, a category that includes fast food outlets and hot food purchased at selected stores. Even food delivery orders grew 7%, despite increased in-restaurant dining.
| RESTAURANTS STATEWIDE | |
|---|---|
| April vs. March | Change |
| Daily Sales | +8% |
| Daily Transactions | +4% |
| Ticket Average | +1% |
| OʻAHU RESTAURANTS | |
|---|---|
| April vs. March | Change |
| Daily Sales | +9% |
| Daily Transactions | +7% |
| Ticket Average | +1% |
| MAUI RESTAURANTS | |
|---|---|
| April vs. March | Change |
| Daily Sales | +8% |
| Daily Transactions | +6% |
| Ticket Average | +2% |
| HAWAIʻI ISLAND RESTAURANTS | |
|---|---|
| April vs. March | Change |
| Daily Sales | +6% |
| Daily Transactions | +3% |
| Ticket Average | +2% |
| CAUSAL AND FINE DINING | |
|---|---|
| April vs. March | Change |
| Daily Sales | +8% |
| Daily Transactions | +7% |
| Ticket Average | +1% |
| QUICK SERVICE RESTAURANTS | |
|---|---|
| April vs. March | Change |
| Daily Sales | +8% |
| Daily Transactions | +4% |
| Ticket Average | +3% |
| RESORT/WAIKĪKĪ RESTAURANTS | |
|---|---|
| April vs. March | Change |
| Daily Sales | +10% |
| Daily Transactions | +6% |
| Ticket Average | +3% |
| DELIVERY SERVICE CONTRIBUTION | |
|---|---|
| April vs. March | Change |
| 7% of total Sales | +1% |
| Delivery Daily Sales | +7% |
Glossary:
- Casual Dining: Restaurants that serve moderately priced food in a casual atmosphere.
- Daily Sales: Average daily gross sales before discounting.
- Daily Transactions: How many customers are served daily on average. This measure is calculated by each transaction regardless of party size for quick serve restaurants and by each person for fine dining.
- Delivery: Products delivered by third parties or by the restaurant to the customer’s location.
- Fine Dining: Full-service, sit-down restaurants with specific dedicated meal courses, waiter service and white table cloth.
- Online ordering: All purchases completed online via app or point-of-sale system.
- Quick Service Restaurant: Restaurants that serve fast food with no or minimal table service.
- Table turn: Every time a table is seated, then cleaned for a new party.
- Ticket/Check Average: Measures the average amount spent per transaction.
- To-go: Orders meant for off-premise consumption, whether that’s curbside service, takeout or delivery.


