Here’s Which Ethnic Groups Make the Most Money in Hawai‘i
Some new data is surprising, but other data confirms what has long been known about Hawai‘i’s social and economic hierarchy.
People who are Japanese or part Japanese have the highest median family income in Hawai‘i at $114,825 a year, according to the U.S. Census Bureau’s latest data, which is from 2019.
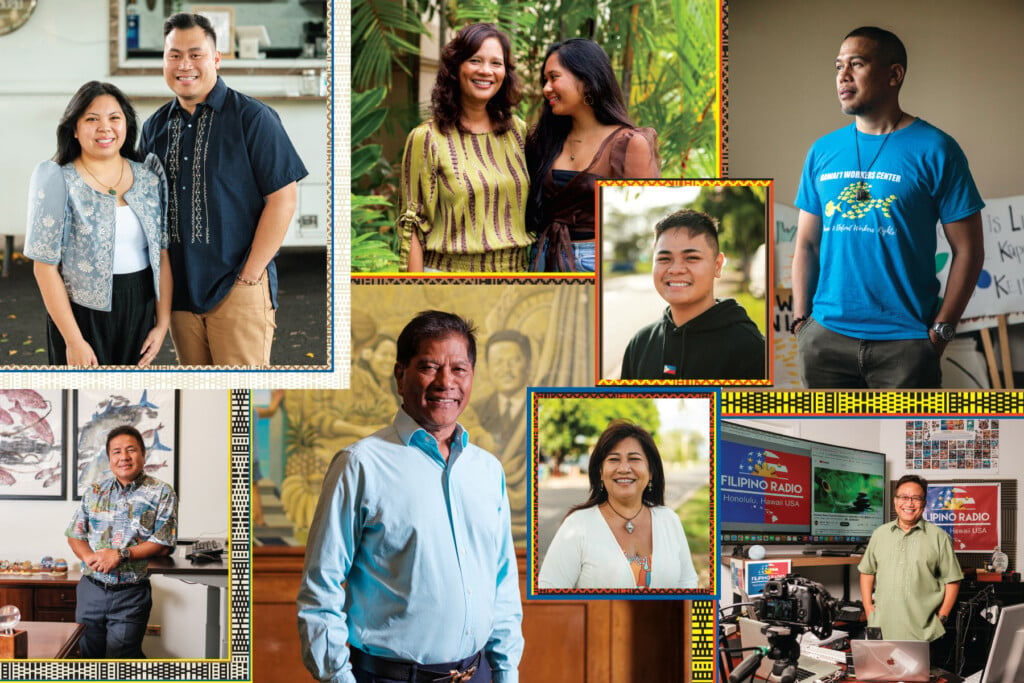
People who are Filipino or part Filipino rank second with a median family income of $102,324. Among the state’s major ethnic groups, people who are part or full Filipino also have the largest average family size, a major factor in their high family income ranking, says Carlie Liddell, head statistician of the Hawai‘i State Data Center.
Almost 80% of people who are at least part Filipino live in family households, the average size of which is 4.4 people. The number ranges between 3.25 to 3.93 for the state’s other major ethnic groups.
This story is based largely on the Census Bureau’s 2019 data that provides estimates for Hawai‘i’s White, Filipino, Japanese, Chinese, Native Hawaiian and Hispanic populations. That data also covers people whose mixed ethnicity includes one of those six groups.
We also look beyond just income to find how Hawai‘i’s largest ethnic groups compare in education, employment and homeownership to provide a fuller picture of their socioeconomic status. Higher education, for instance, usually leads to higher income, and homeownership is an important indicator of accumulated wealth.
“We see, of course, that newer immigrants to Hawai‘i, their populations are younger, less established, and we do see that the more established immigrant groups do have higher homeownership, they’re older, they have higher incomes,” Liddell says. “So it does seem to track with periods of immigration.”
Multiracial Population
Hawai‘i has had the largest multiracial population in the country since multiracial population Census data became available in 2000, says Eugene Tian, chief state economist. In 2019, nearly 22.3% of people living in the Aloha State were multiracial, compared with 3.4% of the U.S.
The foundations of our multiracial society include Hawai‘i’s agricultural history. Male workers from China and Japan came to work on the Islands’ sugar plantations and often married local women. Later, men from the Philippines arrived to work on local plantations.

Locals who are at least part Japanese tend to be older and less likely to be unemployed than the overall population. They’re also more likely to be managers, with higher rates of them working in business, science and arts occupations.
And they have the highest homeownership rate of Hawai‘i’s largest ethnic groups. Almost 76% of local Japanese live in owner-occupied units, compared with 69% of local Chinese and 64.1% of local Filipinos. About 60% of Hawai‘i’s total population lives in owner-occupied units, which Tian says is one indicator of homeownership.
People of Japanese descent are also more likely to have finished college: 43% have bachelor’s degrees or higher education. Whites are second at 39.4%, followed by local Chinese at 37.6%.

Median Age
Locals who are at least partially Japanese have an older median age than that of the total population. Eugene Tian, chief state economist, says this is because 68.7% of this group is Japanese alone, and the median age for the Japanese-alone population is 59.4.
Hawai‘i’s multiracial population is younger than the total population, he adds: “In Hawai‘i, people who identify as two or more races have an average age of 26.7, but the median age for the total population is 39.6,” he says.
Local Japanese also have the second highest life expectancy among the state’s major ethnic groups and there have been fewer new and young immigrants from Japan in the last 30 years. In addition, the Japanese-alone population has been declining in the last 20 years.
“In summary, the existing Japanese population are declining and aging, and very few new and young immigrants,” Tian says. “Japanese has the
highest percentage of people 65 years and above, and the lowest percentage of families with children under 18.”
Native Hawaiians and Hispanics
The median family income for Hawai‘i’s overall population in 2019 was $96,462. Of the state’s largest ethnic groups, Native Hawaiians and Hispanics earned the least. The median family income for locals who are at least part Native Hawaiian was $84,699; for locals who are at least part Hispanic, $76,054.
One reason Native Hawaiians and Hispanics have lower family incomes is that they tend to be younger, Tian says. In 2019, Native Hawaiians had a median age of 30.3 years and Hispanics 25.9. The overall population’s median age was 39.6.
“When people are young, they tend to have a limitation, they may not have the adequate education level to go to the occupations like professional services and other business services,” Tian says.
Native Hawaiians tend to have higher unemployment rates and less education. Only 18.3% of Native Hawaiians age 25 and older have bachelor’s or graduate degrees, compared with 33.6% of the overall population.
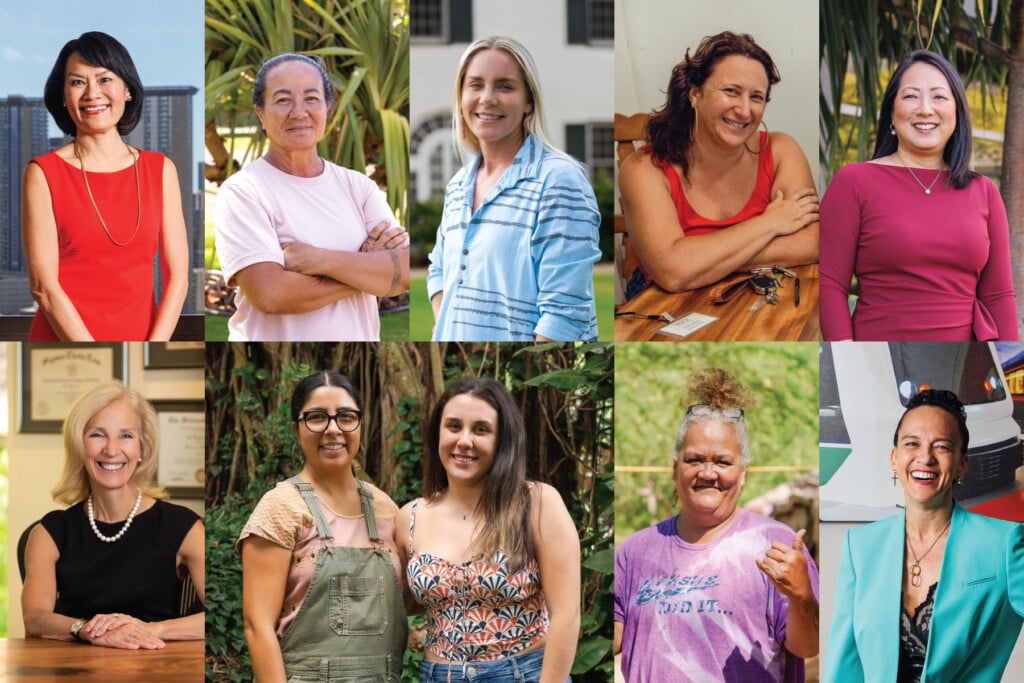
Related stories: The Gender Pay Gap Had Narrowed in Hawai‘i. Then the Pandemic Arrived, Which Ethnic Group Makes the Most Money?
Jonathan Okamura, professor emeritus of ethnic studies at UH Mānoa, says Hawai‘i’s reliance on tourism also plays a role in lower incomes. About 30% of local Filipinos worked in service occupations in 2019, compared with 23.3% of the total population. Hispanics also had greater representation at 26.2%; for Native Hawaiians, the rate was 23%.
Local Hispanics have the highest renter-occupied unit rate of all large ethnic groups. Nearly 63% of Hispanics rent their homes; across ethnic groups, the rate is nearly 40%. Tian attributes this at least partly to the younger median age of local Hispanics.
“They are relatively young and they are relatively low income people and, in Hawai‘i, we do see with the age increase more homeownership,” he says.
Native Hawaiians had a homeownership rate of 57.2% – lower than the state average but high among low-income groups in the Islands, Tian says. He adds that’s probably attributable to the Hawaiian home lands program, which provides 99-year land leases at $1 a year for individuals with at least 50% Hawaiian ancestry.


Smaller Ethnic Groups
Census data for Hawai‘i’s smaller ethnic groups, like Samoans, Marshallese, Chamorro, Vietnamese, Koreans, Okinawans, Tongans, American Indians/Alaska Natives and African Americans, aren’t available for 2019. Those groups are so small in the Islands that special tabulations are done only every five years or so, Liddell says, adding that the next one may be released in 2023.
The latest available data on those groups comes from a 2018 report, titled “Demographic, Social, Economic, and Housing Characteristics for Selected Race Groups in Hawai‘i,” produced by the state Department of Business, Economic Development & Tourism. That report used Census data from 2011 through 2015 and also focused on groups defined by multiple races and ethnicities.
The 2018 report showed that Blacks or African Americans had the highest rates of employment, while Marshallese had the lowest. Only 46.7% of the Marshallese population aged 16 and older was employed. Tian says this may be because many Marshallese are still in school: The group’s median age is only 18.5.
Okinawans were the only small ethnic group to have a homeownership rate higher than the state average, according to the report. “Although homeownership rates are low for all racial groups except the Japanese and Okinawans, it is particularly low among those with younger age structures,” the report’s authors noted. “Six of the seven populations with homeownership rates under 50% are populations with median ages under 28 years old.”
Okinawans and Guamanians/Chamorros were the only small ethnic groups to have median family incomes higher than that of the total population. In the 2018 report, the total population had a median family income of $80,778. Okinawans earned $108,525 and Guamanians/Chamorros $86,607.


Ethnic Hierarchy
The hierarchy of the richest and poorest ethnic groups in Hawai‘i hasn’t changed much since the 1970s, Okamura says. That ranking puts Japanese, Chinese and Whites at the top, with Filipinos and Native Hawaiians nearer the bottom. Okamura is the author of the 2008 book “Ethnicity and Inequality in Hawai‘i” and uses median family income, educational attainment and occupational status to gauge a group’s socioeconomic status.
He says the only major recent change was a gradual one that became evident in 1990, when Japanese Americans joined Chinese Americans and Whites as the socioeconomically dominant groups in the Islands. Prior to that, Japanese Americans had slowly been rising in socioeconomic status, and World War II gave Japanese veterans access to college. By the 1980s, local Japanese had comparable incomes to Whites and Chinese Americans but did not yet have comparable levels of higher education.
“What we haven’t seen since 1970 is any other indication of socioeconomic mobility among the subordinate groups like Filipinos, Samoans, Hawaiians,” he says, “like groups moving up in the same way that historically Chinese first and then Japanese moved up socioeconomically once they left the plantations and entered the middle class, got professional, other white-collar employment, sent their children to college, obtained much higher incomes.”
That lack of socioeconomic mobility is an issue, Okamura says, because it shows that ethnic inequality persists in the Islands.
“Ethnicity as a structural principle unfairly restricts access and opportunities for the subordinate minorities – including Native Hawaiians, Samoans, Filipino Americans, and other immigrant minorities – and thereby maintains them in their subjugated position in low-paying service and other blue-collar jobs that preclude their socioeconomic mobility,” he wrote in his 2008 book.